Hi, this is Wayne again with a topic “Using the Excel PERCENTILE Functions”.
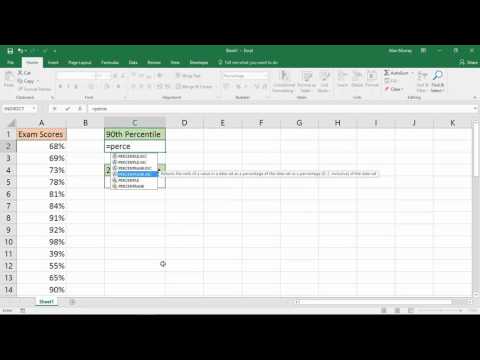
In this Excel video, I’m going to show you how to use the Excel percentile functions. This includes percentile, percentile, Doc and percentile.in NC. Let’S get started so here I am in a spreadsheet, with information about different foods and their nutrients and other characteristics, and I would like to identify the foods that are in the 90th percentile for calories, protein fats, carbs and fiber. How would I do that? I would use the percentile function, I’m going to start by going to the bottom of the data that I have here in this spreadsheet I’ll hold the control key and tap the down arrow. That takes me to the bottom of this range of data.
You can see. There’S over a thousand different foods in this list, and there is some missing data, but that’s: okay, I’m going to click on d196 and I’ll type in equals. Percentile now notice that Excel is showing me three different percentile functions and one of them has a little warning. Just percentile it says it’s available for compatibility with the older versions of excel, so that makes me think that this function is a little outdated.
It’S okay! I can still use it, but that’s why I’m showing you all three of the percentile functions now that I’ve typed percentile I’ll put in the left parenthesis Excel, is now expecting an array. So it’s going to examine the array that I put in here. It’S going to calculate it and determine based on the data in that range or array. What constitutes the 90th percentile for the array? I could click and drag to highlight the array or range that I want to examine, but there are over a thousand different cells that I would have to select, so instead, I’m just going to type the cell reference D2 through, which is a colon d195 that highlights The array that I want and now I’ll put in a comma now it’s looking for the K, and that just means the percentile. What is the percentile that we’re looking for? Well, I want the 90 percentile and I can express this percentile by typing in 90 %. Close quote: tap, enter and there’s the result.
21.7. Now another way to write the same formula. If you look up here in the formula bar would be to, instead of putting in 90 %, I could put in .9 or 090 when I tap enter notice that it produces. The same result. Excel can handle the decimal version of 90 % and it can also handle it using the percent symbol, so that worked out great. Now I need to calculate the 90th percentile for protein fat, carbs and fiber. The good news is, as you probably know, I don’t have to rewrite this formula.
I can just use the autofill handle the little green Square in the corner of this cell, just click and hold on that handle and drag across the bottom of this range of data and I’ll release the mouse button, and it calculates the 90th percentile for each of These columns, so these numbers mean that 90 % of the the numbers in these columns fall below this number. 90 % of the numbers in column D are lower than 21.7, 90 % in the protein column are below 21, 90 % in the fat column are below 16, Etc. I’M just going to click here on c196 and I’ll, just type 90th percentiles tap enter and then I’ll double click between C and D to make that text fit.
Now. How would this work with the other two percentile functions? If I click on cell d197, I can type equals percentile, but this time I’m going to use percentile, EXC I’ll, just double click on that one. You’Ll notice that this version of the percentile function does not have a warning attached to it. It works just the same way as the percentile function, but the exe. What that means is that it is exclusive of zero and one. In other words, when we get to the K, we cannot use the number zero and we cannot use the number one but anything in between.

Yes, we can once again I need to start by putting in my array so D2 through 1095 comma and if I put zero and tap enter notice, that I get an error, because this function needs to exclude 0o and one. So, let’s change that to 0.9 write parenthesis tap, enter notice that I do get a slightly different result, which is interesting. I’M going to now click and drag across on the autofill handle to copy this across the rest of the data looks identical. Let’S try it now with the third percentile function: percentile.in C Inc stands for inclusive, in other words, in this formula I can include zero or one so percentile.in C left parenthesis.
I now need to put in the array D2 through d195 comma – and here I just want to show you that you still can use 90 % instead of 0.9. So this time I will put in 90 % right. Parth is tap, enter on the keyboard and I get 21.7 so now we know why there’s a variation here in this cell and it’s because the formula in this cell is exclusive. It’S not counting zero and this formula is inclusive.
So now I’m going to use the autofill handle to drag across the rest of the data and we’ve successfully calculated the 90th percentile for each of these characteristics or nutrients. If I wanted to take this a step further, I could set up some condition formatting. So I’m going to click here on cell d195 and I’ll hold the control key and the shift key and tap the up arrow on the keyboard that should select the entire column. Now, on the Home tab in the Styles group, I’m going to click on conditional, formatting highlight cells rules and I’m going to select greater than 251.

If the number is higher than 251, then I want to format it with green fill with dark red text. I click. Okay and now, we’ve identified throughout the spreadsheet the highest number of calories, these foods that are in green, are in the 90th percentile of calories among all of the foods in this spreadsheet, we could do the same with protein.
21 is the marker for the 90th percentile? So I’ll just click here hold control, hold shift, tap the up, arrow and I’ll have to tap it a few times, because I have some blanks in my data. I just held the up Arrow to go all the way up to the top quickly and again Home tab. Styles group conditional formatting highlight cells greater than 20 again with green fill dark green text.

I click okay and now we can quickly find the foods whose protein is in the 90th percentile and of course I can quickly do the same thing with fat. Carbs and fiber conditional formatting highlight cells rules greater than 15 highlight with green fill, dark green text. Okay, so in this article we’ve looked at the three different percentile functions: the slightly outdated, perhaps percentile function and percentile EXC, which excludes the numbers, Z and 1, and then we have the percentile.in C, which includes the numbers 0o and 1.
Thanks for watching. I hope you found this tutorial to be helpful. If you did please like follow And subscribe, and when you do click the bell and you’ll be notified. When I post another video, if you’d like to support my channel, consider clicking the thanks button below the video and supporting me through my patreon account and by buying Channel merch and you’ll, see information about those options in the description below the video .