
Hi, this is Wayne again with a topic “Calculate Mean Median Mode and Standard Deviation in Excel”.
In this article, i will show you how to generate some common statistical data in microsoft excel and here in the spreadsheet. We have a list of many nba basketball players, along with information about their performance in the 2020-2021 season, and what i’d really like to do is be able to figure out among these 240 nba basketball players. What is the average points per game? What is the median points per game, the mode and the standard deviation and i’d like to figure that out not just for points per game, but for all of these different statistical categories. So let’s look at how to do that.
Let’S start with age. So i’m going to go down here and click on cell d241 in this case and then here on d241, i’m just going to type equals average. As i start typing that you can see excel recognizes the function that i’m typing and it explains what it is.
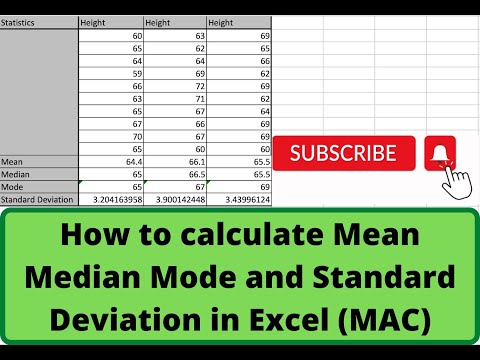
It returns the average or arithmetic mean of its arguments. I’Ll put in my left parenthesis and then at this point all i have to do is click and drag to highlight the data that i want to average. The thing is: there’s 240 lines worth of data, so i’d rather not click and drag to highlight the data, but i know that the data is found in cell d2 through d240, so i’ll just type d2. The way you say through in excel is with a colon. So d2, through d240, put my right parenthesis. You actually don’t have to put that there, but either way tap enter and it’s calculated now the mean or average age of these 240 nba basketball players.
How do we calculate median? It’S very similar i’ll, just type equals median again excel, recognizes the function left parenthesis either click and drag to get the data or just type d2 through d240. This time i will put in the right parenthesis: tap enter. The median age is very similar to the mean age in this case, which is kind of interesting and, of course, median just means the middle value in a list of numbers.
So in this case the middle value is almost the same as the average value. Let’S now figure out the mode of this range of ages, the mode should tell us what is the most common age in this list, so i’ll type equals mode and, as you can see, there are three different mode functions that we can choose from in microsoft. Excel the second and third options will both give the same results, but this third one is a little outdated.
It’S probably going to be phased out eventually, so, let’s go with the second one mode, dot sngl. This will return the most frequently occurring or repetitive value in an array or range of data. Perfect, that’s what i want so i’ll.
Double click on that and then i’ll type in the cell reference d2 through d240, tap enter and there’s the result. 30 is the most common age among this group of nba players. Now, let’s look at standard deviation equals s.
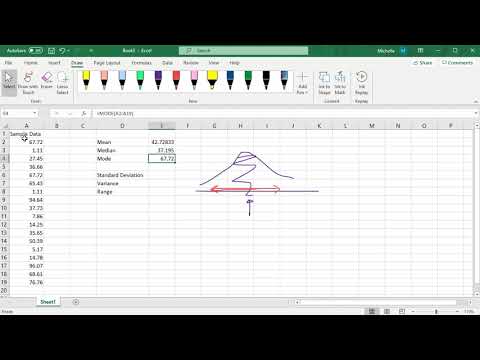
T d e v, if you type that in it, gives you a long list of functions to choose from related to standard deviation and each one is slightly different. You can click through them to get an explanation about how each one is different. In this case, you’ll get about the same results. If you do this one or this one, so i’m going to choose this stdev dot s i’ll double click type in my cell reference and tap enter and that simply i’ve calculated the mean age for this group of nba players, the median age, the mode and the Standard deviation now it’s time to do the same thing again for games played for free, throw percentage, three point percentage points per game and all of that right.
Well, yes, i could calculate each one of those one at a time doing the same formulas that i’ve already used, or i could save myself a lot of time and effort by using the auto fill handle. If i click here on d241, as you know, this is where i typed my average formula. I can just put my mouse on the autofill handle, or sometimes it’s just called the fill handle it’s this little green square in the lower right corner of the cell. When the cell is selected so i’ll put my mouse there, the mouse pointer changes, color and i’ll click and drag and hold the click all the way across my data.

When i release the mouse button, the data is calculated for each column that i included. Let’S do the same thing with median autofill handle click and drag across release the mouse button and the data comes in and what about mode? Let’S try that i’ll drag it across release the mouse button, and the data appears finally standard deviation i’ll calculate that just by clicking and dragging using the autofill handle and there it is so that quickly, i’ve been able to generate the mean median mode and standard deviation For all of these different nba players across all of these different statistical categories, and it’s really as simple as knowing what the functions are: average median mode dot sngl in this case and stdev.s in this case, and then also you need to know the format in which You need to type your formula and then, of course, it sure helps if you know how to use the autofill handle the little green square in the lower right corner of a selected cell. If you’d like to learn more about the autofill handle, you should watch one of my tutorials on that topic.
In the meantime, though, i hope you found this tutorial to be helpful. If you did please like follow and subscribe, and when you do click the bell so you’ll be notified. When i post another video, if you’d like to support my channel, consider clicking the thanks button below the video or you could support me through my patreon account or by buying channel merch and you’ll, find information about those options.
In the description below the video .